ICT Structure Levels (ST/IT/LT) - v7 (by Jonas E)ICT Structure Levels (ST/IT/LT) – Neighbor-Wick Pivots
This indicator is designed for traders following ICT-style market structure analysis. It identifies Short-Term (ST), Intermediary (IT), and Long-Term (LT) swing highs and lows, but with a stricter filter that reduces false signals.
Unlike standard pivot indicators, this script requires not only that a bar makes a structural high/low, but also that the neighboring bars’ extremes are formed by wicks rather than flat-bodied candles. This wick condition helps confirm that the level is a true liquidity sweep and not just random price action.
How it works (conceptual):
Detects pivots based on user-defined left/right bars.
Validates that extremes on both sides of the pivot are wick-driven (high > body for highs, low < body for lows).
Marks valid STH/STL, ITH/ITL, and LTH/LTL directly on the chart with optional price labels.
Uses ATR offset for better label readability.
Alerts can be enabled to notify when a new structural level is confirmed.
How to use it:
Map market structure across multiple layers (ST/IT/LT).
Identify true liquidity grabs and avoid false highs/lows.
Integrate with Break of Structure (BOS) and Change of Character (CHoCH) strategies.
Combine with other ICT concepts (Order Blocks, Fair Value Gaps, Liquidity Pools).
What makes it unique:
Most pivot indicators mark every high/low indiscriminately. This script filters pivots using wick validation, which significantly reduces noise and focuses only on the levels most relevant to liquidity-based trading strategies.
Search in scripts for "order block"

AI Fib Strategy (Full Trade Plan)This indicator automatically plots Fibonacci retracements and a Golden Zone box (61.8%–65% retracement) based on the 4H candle body high/low.
Features:
Auto-detects session breaks or daily breaks (configurable).
Draws standard Fib retracement levels (0%, 23.6%, 38.2%, 50%, 61.8%, 78.6%, 100%).
Highlights the Golden Zone for high-probability trade entries.
Optional Take Profit extensions (TP1, TP2, TP3).
Fully compatible with Pine Script v6.
Usage:
Best applied on intraday charts (15m, 30m, 1H).
Use the Golden Zone for entry confirmations.
Combine with candlestick patterns, order blocks, or volume for stronger signals.

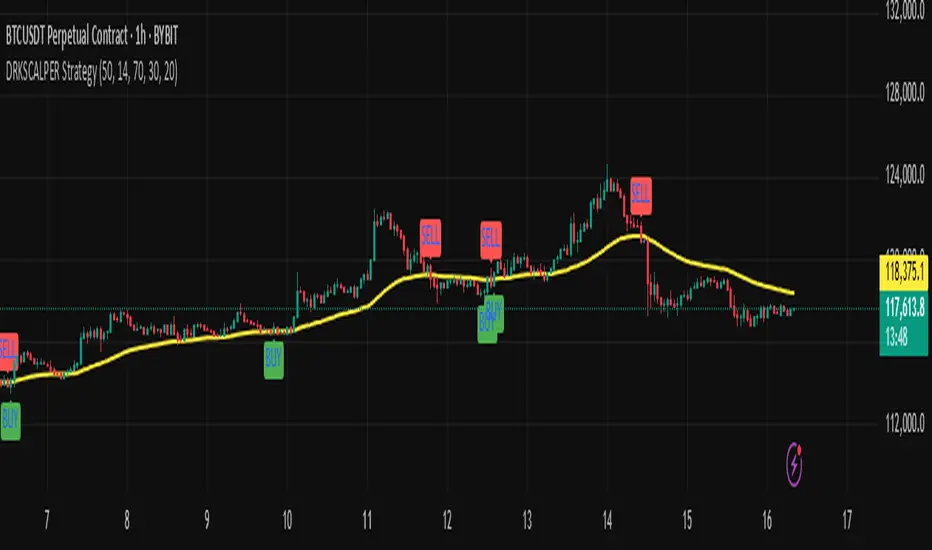
DRKSCALPER Strategy"This indicator is designed to help traders identify market structure shifts, order blocks, and liquidity zones. It is useful for scalping and swing trading, and works on multiple timeframes."
Cvd Divergence Signals with filter.
CVD Divergence + Candles - False Signal Filter
Hey traders,
I want to share my custom indicator with you. Through testing, I've found that CVD (Composite Volume Delta) captures divergences much more accurately than traditional tools like RSI. But this isn't just another divergence indicator - I've added strict candlestick pattern confirmation to filter out false signals. I'll keep improving this tool over time, and I welcome all your suggestions in the comments.
How it works step-by-step:
1. First, it detects CVD divergences (the delta between buy/sell volumes)
2. Then confirms each signal with reversal candlestick patterns:
- Hammer/Hanging Man
- Engulfing
- Pin Bar
- Inside Bar
Why mine beats standard CVD indicators:
• No raw divergences - only shows signals confirmed by BOTH volume AND price action
• Eliminates 80% of junk signals from basic versions
• Adaptable to any asset and timeframe
Simple usage guide:
Green arrows = Buy when:
- CVD shows bullish divergence
- AND a hammer/pin bar appears
Red arrows = Sell when:
- CVD shows bearish divergence
- Confirmed by hanging man/engulfing pattern
Pro tip:
For best results, combine with:
• Volume profile analysis
• Smart Money concepts (order blocks, FVGs )
Important notes:
This isn't a holy grail - I personally use it with support/resistance levels. Works best on 5M charts for scalping.
**PS** Got questions? Drop them in comments!

Session High/Low Sweeps ICT — Asian/London/NY (Big Sal Trades)Description:
This tool automatically tracks session or timeframe highs and lows, plots them on your chart, and removes them instantly when price sweeps or touches them — so you never deal with stale levels again.
⸻
Core Features
• Dynamic High/Low Plotting – Color-coded lines for multiple sessions or timeframes.
• Touch-to-Delete – Levels are deleted automatically when price touches or breaks them.
• Lookback Pruning – Remove old levels after a set number of bars/days.
• Multi-Timeframe Support – Works on intraday and higher timeframes.
• Custom Sensitivity – Choose tick buffer, wick vs close confirmation, and session types.
• No Repainting – Updates in real time, keeps your chart accurate.
⸻
Settings Instructions
Session Selection
• Toggle Asia, London, NY or other sessions you want to track.
Delete on Touch Settings
• Confirm Type:
• Wick – Delete as soon as price wick touches/breaks the level.
• Close – Delete only if candle closes beyond the level.
• Confirm Ticks:
• 0 – Instant deletion on touch.
• 1–2+ – Require price to exceed by this many ticks before deletion.
Lookback Settings
• Max Days/Bars: Remove levels older than this period.
Line Style Settings
• Customize color, style, and width for each session/timeframe to keep charts organized.
⸻
Tip:
Use a small tick confirmation for fast-moving markets like NASDAQ, and larger confirmation for slower assets. Combine with liquidity zones, order blocks, or SMC concepts for powerful trade confluence.
Fibs Has Lied 🌟 Fibs Has Lied - Indicator Overview 🌟
Designed for indices like US30, NQ, and SPX, this indicator highlights setups where price interacts with key EMA levels during specific trading sessions (default: 6:30–11:30 AM EST).
🌟 Key Features & Levels 🌟
🔹EMA Crossover Setups
The indicator uses the 100-period and 200-period EMAs to identify bullish and bearish setups:
- Bullish Setup: Triggers when the 100 EMA crosses above the 200 EMA, followed by two consecutive candles opening above the 100 EMA, with the low within a specified point distance (e.g., 20 points for US30).
- Bearish Setup: Triggers when the 100 EMA crosses below the 200 EMA, followed by two consecutive candles opening below the 100 EMA, with the high within the point distance.
- Signals are marked with green (buy) or red (sell) triangles and text, ensuring you don’t miss a setup. 📈
🔹 Reset Conditions for Re-Entries
After an initial setup, the indicator watches for “reset” opportunities:
- Buy Reset: If price moves below the 200 EMA after a bullish crossover, then returns with two consecutive candles where lows are above the 100 EMA (within point distance), a new buy signal is plotted.
- Sell Reset: If price moves above the 200 EMA after a bearish crossover, then returns with two consecutive candles where highs are below the 100 EMA (within point distance), a new sell signal is plotted.
This feature captures additional entries after liquidity grabs or fakeouts, aligning with ICT’s manipulation concepts. 🔄
🔹 Session-Based Filtering
Focus your trades during high-liquidity windows! The default session (6:30–11:30 AM EST, New York timezone) targets the London/NY overlap, where price often seeks liquidity or sets up for reversals. Toggle the time filter off for 24/7 signals if desired. 🕒
🔹Symbol-Specific Point Distance
Customizable entry zones based on your chosen index:
- US30: 20 points from the 100 EMA.
- NQ: 3 points from the 100 EMA.
- SPX: 2.5 points from the 100 EMA.
This ensures setups are tailored to the volatility of your market, maximizing relevance. 🎯
🔹 Market Structure Markers (Optional)
Visualize swing points with pivot-based labels:
- HH (Higher High): Signals uptrend continuation.
- HL (Higher Low): Indicates potential bullish support.
- LH (Lower High): Suggests weakening uptrend or reversal.
- LL (Lower Low): Points to downtrend continuation.
- Toggle these on/off to keep your chart clean while analyzing trend direction. 📊
🔹 EMA Visualization
Optionally plot the 100 EMA (blue) and 200 EMA (red) to see key levels where price reacts. These act as dynamic support/resistance, perfect for spotting liquidity pools or ICT’s Power of 3 setups. ⚖️
🌟 Customization Options 🌟
- Symbol Selection: Choose US30, NQ, or SPX to adjust point distance for entries.
- Time Filter: Enable/disable the 6:30–11:30 AM EST session to focus on high-liquidity periods.
- EMA Display: Toggle 100/200 EMAs on/off to reduce chart clutter.
- Market Structure: Show/hide HH/HL/LH/LL labels for cleaner analysis.
- Signal Markers: Green (buy) and red (sell) triangles with text are auto-plotted for easy identification.
🌟 Usage Tips 🌟
- Best Timeframes: Use on 3m for intraday scalping and 30m for swing trades.
- Combine with ICT Tools: Pair with order blocks, fair value gaps, or kill zones for stronger setups.
- Focus on Session: The default 6:30–11:30 AM EST session captures London/NY volatility—perfect for liquidity-driven moves.
- Avoid Overcrowding: Disable market structure or EMAs if you only want setup signals.

Fractal Suite: MTF Fractals + BOS/CHOCH + OB + FVG + Targets Kese Way
Fractals (Multi-Timeframe): Automatically detects both current-timeframe and higher-timeframe Bill Williams fractals, with customizable left/right bar settings.
Break of Structure (BOS) & CHoCH: Marks structural breaks and changes of character in real time.
Liquidity Sweeps: Identifies sweep patterns where price takes out a previous swing high/low but closes back within range.
Order Blocks (OB): Highlights the last opposite candle before a BOS, with customizable extension bars.
Fair Value Gaps (FVG): Finds 3-bar inefficiencies with a minimum size filter.
Confluence Zones: Optionally require OB–FVG overlap for high-probability setups.
Entry, Stop, and Targets: Automatically calculates entry price, stop loss, and up to three take-profit targets based on risk-reward ratios.
Visual Dashboard: Mini on-chart table summarizing structure, last swing points, and settings.
Alerts: Set alerts for new fractals, BOS events, and confluence-based trade setups.

Multi-Tool Nasdaq US100 IndikatorA combination of several tools such as moving averages (EMA 50, 100, 200), Fibonacci retracements, pivot points, RSI (Relative Strength Index), order blocks, fair value gaps, supply and demand zones, and a simple volume profile.
The indicator is designed to enable high profitability by combining various established technical analysis approaches into one tool, facilitating decision-making regarding entry and exit points.
The script can be integrated and used directly in TradingView by creating a new indicator script and pasting the code there.

Terminal de Estrategias PRO (MTF + Order Blocks)this is a new test for the implementation of functions on my app web for signals

Josh SMC Key Features of Josh SMC
✅ Automatically detects Order Blocks (OB) — both Bullish and Bearish
✅ Accurately identifies Fair Value Gaps (FVG) and tracks whether they are “filled” or not
✅ Detects Change of Character (CHOCH) to signal potential trend reversals
✅ Analyzes price structure in real-time based on Smart Money Concepts
✅ Beginner-friendly, yet powerful for advanced traders
✅ Customizable zone colors and number of OB/FVG displays
✅ Works on all timeframes from 1-minute and up
📌 What You’ll Gain from Using Josh SMC
🔺 Spot potential reversal zones before the crowd
🔻 Avoid chasing fake trends and getting trapped
🎯 Plan your entries and exits with OB and FVG precision
🚫 Eliminate guesswork from your analysis
🚀 Trade with confidence and structure — like smart money does
🔍 Who Is This For?
Traders who follow Smart Money Concepts (SMC), ICT, or Price Action
Anyone seeking high-quality entry/exit zones
Traders who want to understand how institutions move the market

Volume Agregado Perp + Spot BTC only🔍 Aggregated Volume — Spot, Perpetual, or Both (with Bands & Alerts)
Overview:
This indicator aggregates volume data from multiple exchanges (Spot and Perpetual) into a single unified chart. It calculates the simple moving average (SMA) and standard deviation (STDEV) over the aggregated volume, and plots dynamic volume bands at customizable deviation levels.
Includes an option to display only Spot, only Perpetual, or both combined, and provides automatic alerts when volume breaks above or below each band level.
📊 How It Works
Fetches volume from top exchanges using request.security() (e.g., Binance, Bybit, Coinbase, OKX, Kraken, Bitget).
To avoid distortion caused by disproportionally large Perpetual contract volumes, perp data is normalized by dividing by 100. This brings it closer to Spot volume scale.
Computes SMA and STDEV of the aggregated volume, and plots upper/lower bands based on 1x, 2x, and 3x standard deviations.
Issues alerts when the current volume exceeds or drops below the defined thresholds.
🧠 Interpretation
Above Upper Bands (Lv1/Lv2/Lv3): Signals volume spikes, which can indicate breakouts, momentum ignition, or exhaustion moves depending on context. Higher levels (Lv3) suggest more extreme events.
Below Lower Bands: Indicates low activity, potential consolidation, or market pause.
Best used in combination with price structure, VWAP, order blocks, or volume delta/OI for deeper context.
⚙️ Parameters
SMA/STDEV Period – Default: 20 candles.
Band Levels (1/2/3 STDEV) – Fully configurable multipliers.
Volume Mode:
Spot – Only traditional spot exchange volume.
Perpetual – Only perpetual contracts (normalized).
Both – Combines both (default).
Detector Max Pro com AB=CD (Sinais Otimizados)
📌 Max Pro Detector with AB=CD – Fixed SignalsComplete visual system for cryptocurrency futures.🔹 Buy/Sell by EMAs, RSI, Volume, and Engulfing🔹 Moderate Early Signal🔹 FVG + Automatic Order Blocks🔹 AB=CD Pattern (up and down)🔹 Fixed arrows that do not disappear from the chart

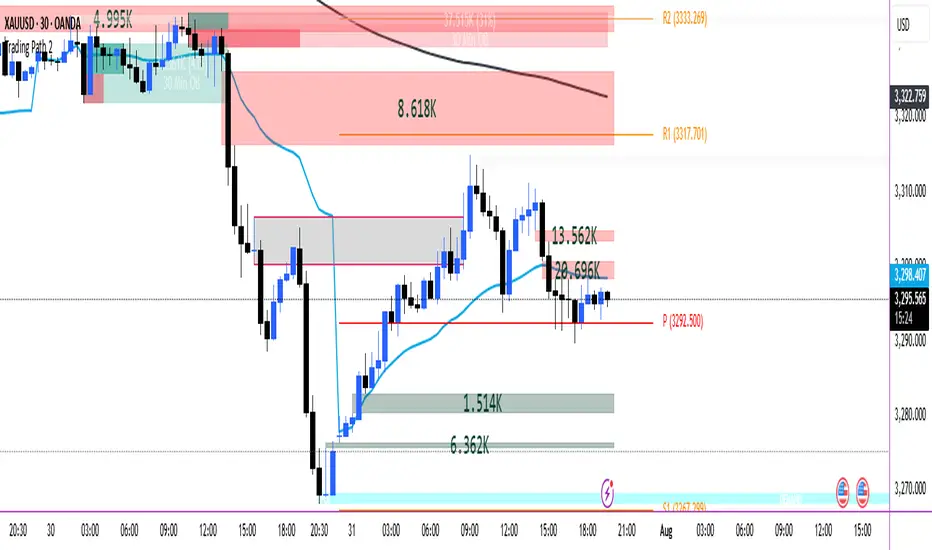
Trading Path
Below indicator are combined in them.
POI
VOLUME FVG
ORDER BLOCKS
VWAP
200 EMA HIGH
PIVOT
Mereks Wick Theory🚨 Wick Precision Zones – Top & Bottom Sniper
📈 Timeframes: 1H & 4H | 🔍 Powered by Smart Wick Logic + FVG Detection
Mark the exact 50% of key wicks where smart money reacts.
This advanced indicator auto-detects Fair Value Gaps (FVGs), Order Blocks, and liquidity zones, then highlights precision reversal levels with color-coded lines (🔴 short / 🟢 long).
✅ Alerts before and when price hits the zone
✅ Works even with just a strong wick inside FVG
✅ Filters in real-time to increase signal accuracy
✅ Built for top- and bottom-ticking entries

PAC Dr.Saeed Gharedaghi V1.2.2This script is a private Price Action & Smart Money Concepts toolkit by Dr. Saeed Gharedaghi. It includes BOS, CHoCH, Order Blocks, FVGs, Equal Highs/Lows, Trend Table (15m to 1D)
🔒 Invite-only script for personal or commercial clients.
To get access, contact @saeedgharedaghi on TradingView.
All code is proprietary and protected under TradingView’s Invite-only license.

CHoCH + BOS + LQ Sweep v6.3.8 PRO+The CHoCH + BOS + LQ Sweep PRO indicator is a comprehensive Smart Money Concepts (SMC) tool designed to identify market structure shifts, liquidity sweeps, and key supply-demand zones across multiple timeframes. It helps traders visualize crucial price action patterns like Change of Character (CHoCH), Break of Structure (BOS), and liquidity grabs that often precede significant market reversals or continuations.
This tool is especially suited for traders applying multi-timeframe analysis and liquidity-based trading strategies on Forex, crypto, indices, or commodities.
1. Liquidity Sweeps (LQ Sweeps)
Identifies when price sweeps previous highs/lows (stop hunts/liquidity grabs).
Configurable strength setting to filter minor vs. major sweeps.
Optional stop at wick or stop at close logic for more precise entries.
Old sweeps can be displayed or hidden, with user-defined limits for historical sweeps.
2. Multi-Timeframe (HTF) Sweeps
Displays liquidity sweeps from higher timeframes (M15, H1, H4, D1, W1).
Individual checkboxes allow flexible combinations (e.g., show only H1 & H4 sweeps).
Unique colors for each timeframe to differentiate visually on the chart.
3. Supply/Demand Zones
Automatically plots zones around swing highs and lows.
Zones are dynamically updated and locked once price interacts with them.
Configurable view: Show both bullish/bearish zones or filter for one side only.
Option to display/hide old zones and limit the number of zones shown.
4. Historical Sweep Management
Stores up to 5000 sweeps internally, while adhering to TradingView’s rendering limits (max 500 drawn).
Ensures chart clarity by prioritizing the most recent sweeps.

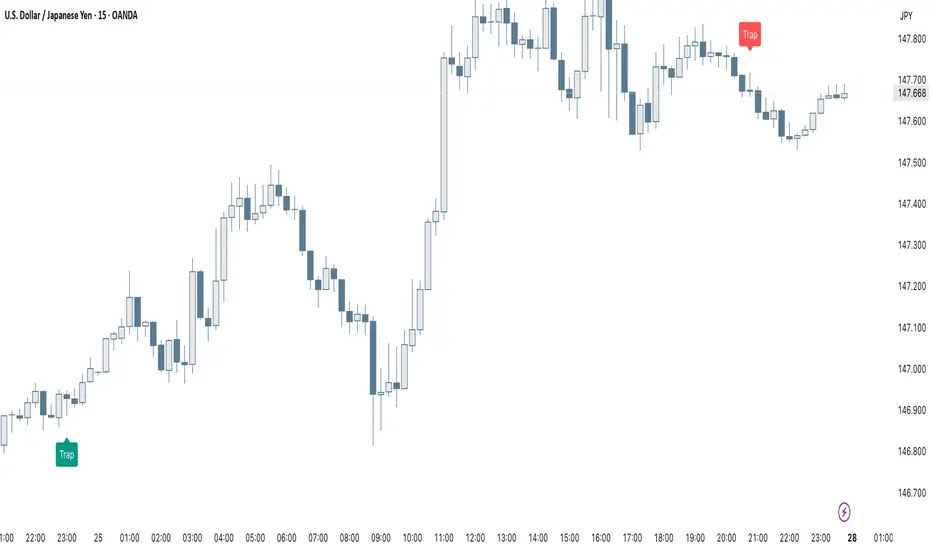
Smart Trap Candle Detector [Pro]Purpose
The Smart Trap Candle Detector is designed to identify common fakeout scenarios in the market, where price breaks a key swing high or low and quickly reverses. These “trap candles” often mislead breakout traders and are commonly used by smart money to induce liquidity before reversing.
How It Works
The script detects potential trap candles using these conditions:
A bearish trap is identified when price breaks above a recent swing high and closes back below it.
A bullish trap is identified when price breaks below a recent swing low and closes back above it.
Optional confirmation from the previous candle’s direction can be enabled.
Swing highs/lows are calculated dynamically using a configurable lookback window.
Once a trap candle is confirmed, a signal is displayed on the chart along with optional labels and alert conditions.
Features
Detects fake breakouts of swing highs and lows
Configurable swing lookback period
Optional confirmation candle filter
Optional label display on trap bars
Built-in alerts for bullish and bearish trap signals
Lightweight, real-time signal detection
Usage Tips
Best used on intraday timeframes such as 15m, 30m, or 1H
Use around key support/resistance zones or liquidity areas
Combine with other confluence signals such as order blocks or RSI divergence
Adjust the swing lookback period depending on the volatility of the asset
Crypto DanR 1.4.2 PC-Roye Edition📜 Crypto DanR 1.4.2 — PC Roye Edition (Open Source)
This indicator combines Smart Money Concepts (SMC), Liquidity Analysis, and Trend Filtering to provide traders with a high-quality tool for intraday and swing trading on assets like XRP/USDT.
✅ What This Script Does
Crypto DanR 1.4.2 integrates the following advanced features:
Break of Structure (BOS) & Change of Character (CHoCH):
Detects key shifts in market structure
Helps confirm trend direction and reversal points
Fair Value Gaps (FVG):
Displays unmitigated liquidity voids using a style inspired by LuxAlgo
Highlights potential retracement zones where smart money may re-enter
Equal Highs / Equal Lows (EQH/EQL):
Marks liquidity zones that institutions often target before reversals
Order Blocks (OB):
Identifies potential institutional demand/supply zones
Option to filter by wick, body, or mitigation logic
Fibonacci Volatility Bands (based on BigBeluga’s logic):
Detects potential price extremes using Fib extensions on volatility
10 Moving Averages in One (inspired by hiimannshu's script):
Supports 10 custom MAs (SMA, EMA, RMA, HMA, VWMA, etc.) with adjustable source and timeframe
Ideal for trend filtering or dynamic support/resistance
Vector Candles (TradersReality / PVSRA):
Color-coded candles showing real-time volume pressure and trend bias
Visual Trade Plan:
Optional overlay for entry, stop-loss, and take-profit planning
Displays risk-to-reward ratio and potential % gain/loss live
🧠 How It Works
The script uses a price-action-first approach, built around concepts from Smart Money Theory. CHoCH and BOS detect structural shifts, while FVGs and OBs help forecast likely reaction zones. The multiple moving averages act as a trend filter to avoid entering against momentum.
This combination allows traders to:
Enter on mitigations or breakouts
Set stops outside liquidity zones
Manage trades visually with dynamic risk/reward levels
📊 Best Use Cases
15m or 1h scalping (ideal)
Swing trading on 4h
Works well on crypto, FX, and indices
🙏 Credits
TradersReality for PVSRA logic via public library
LuxAlgo for FVG inspiration
hiimannshu for 10-in-1 MA logic
BigBeluga for Fibonacci Bands methodology
All reused logic is significantly modified and part of a broader framework.
📌 Notes
Script is open-source to promote transparency and collaboration
Please do not copy-paste and republish without adding meaningful improvements
Feedback and suggestions welcome!

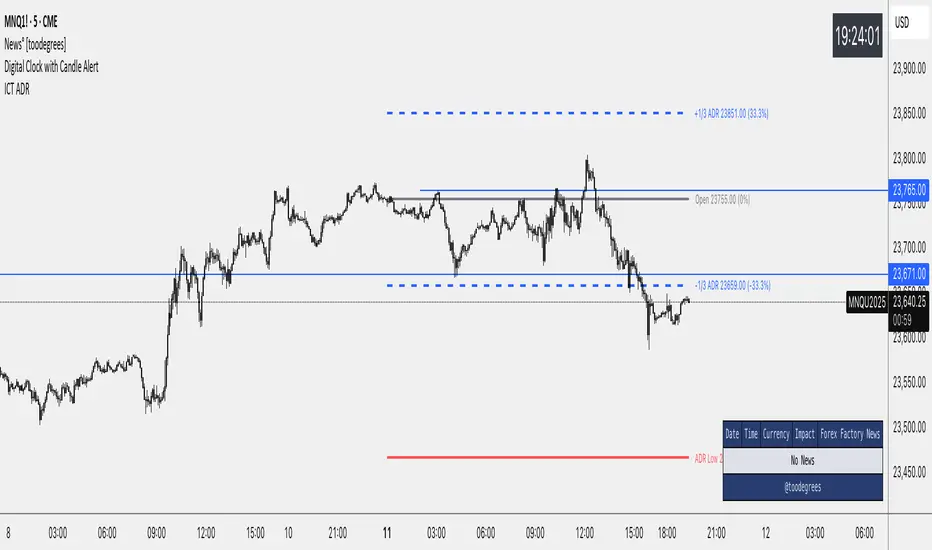
ICT Average Daily Range (ADR)📊 ICT Average Daily Range (ADR) Indicator
This indicator implements the Average Daily Range (ADR) concept taught by ICT (Inner Circle Trader). It calculates the average range of previous trading days and projects key levels for the current session, helping traders identify high-probability targets and reversal zones.
━━━━━━━━━━━━━━━━━━━━━━━━━━━━━━━━━━━━━━━━
✨ KEY FEATURES
- Accurate ADR Calculation - Uses only completed trading sessions (excludes current incomplete day)
- ICT Judas Swing Levels - Highlights the critical 1/3 ADR levels where institutional manipulation often occurs
- Two Calculation Modes - New York Midnight (ICT recommended) or Classic Daily
- Customizable Fractional Levels - 1/3, 2/3, 25%, 50%, 75% of ADR
- Smart Labels - Display price levels and percentage from open
- Flexible Visual Style - Separate line styles for different level groups
- Session Dividers - Optional vertical lines at session start
━━━━━━━━━━━━━━━━━━━━━━━━━━━━━━━━━━━━━━━━
📅 WEEKEND SESSION HANDLING
How Forex Sessions Work:
- Monday-Thursday: Full 24-hour sessions
- Friday: Partial session (00:00 to ~17:00 NY time)
- Sunday: Partial session (~17:00 NY to Monday 00:00)
- Saturday: No trading
Impact on ADR:
Both Friday and Sunday are partial sessions which can lower your ADR average. For example: Mon-Thu average 100 pips, Fri 70 pips, Sun 30 pips = 5-day ADR of 80 pips.
Other Markets:
- Crypto: 24/7 trading, no partial days
- Futures/Stocks: No Sunday session
━━━━━━━━━━━━━━━━━━━━━━━━━━━━━━━━━━━━━━━━
🎓 ICT CONCEPTS
Average Daily Range (ADR)
Statistical measure of average price movement per day. Acts as a "magnet" for price - markets tend to fulfill their ADR.
1/3 ADR Levels - "Judas Swing"
ICT's signature concept for identifying manipulation zones. Price often sweeps these levels to trap retail traders before reversing. High-probability reversal areas during London/NY sessions.
━━━━━━━━━━━━━━━━━━━━━━━━━━━━━━━━━━━━━━━━
⚙️ SETTINGS GUIDE
ADR Period: Number of days for calculation (default 5)
- Lower values = More responsive
- Higher values = Smoother levels
Calculation Mode:
- New York Midnight - ICT standard, best for Forex
- Classic Daily - Exchange timezone
Level Display:
- ADR High/Low - Primary targets
- 1/3 Levels - Judas Swing zones
- 2/3 Levels - Trending day targets
- Quarter Levels - 25% and 75%
- 50% Level - Mid-range
Visual Options:
- Separate line styles for each level group
- Customizable colors and width
- Optional labels with price/percentage
━━━━━━━━━━━━━━━━━━━━━━━━━━━━━━━━━━━━━━━━
💡 TRADING TIPS
1. Early Session: If price moves to 1/3 ADR quickly, watch for Judas Swing reversal
2. Mid Session: Use 2/3 levels as continuation targets in trending markets
3. Late Session: ADR completion often marks session extremes
4. Risk Management: Use fractional levels for scaling positions
5. Confluence: Combine with Fair Value Gaps, Order Blocks, and Liquidity Pools
Best Timeframes: 15m, 30m, 1H, 4H for intraday trading
━━━━━━━━━━━━━━━━━━━━━━━━━━━━━━━━━━━━━━━━
📝 NOTES
- Based on concepts taught by ICT (Inner Circle Trader)
- Requires at least 5 completed sessions for full accuracy
- ICT suggested using "New York Midnight" mode
- Weekend sessions handled based on actual market hours
- Be aware that Friday/Sunday partial sessions may lower ADR average
Created with focus on clean implementation and ICT's core teachings.
ParthFintech SMART-MOVE IndicatorThe ParthFintech SMART-MOVE Indicator.V1.0 is a precision-engineered tool developed by Parth Fintech to help traders identify high-probability trend-based entries and exits using a clean confluence of institutional-grade indicators. Whether you're a beginner or an experienced trader, this indicator provides clarity in trend direction and momentum shifts, enhancing both confidence and consistency in your trades.
📊How It Works
- The SMART-MOVE Indicator combines:
- A dynamic trend filter to identify bullish and bearish market bias.
- A powerful momentum indicator to detect price reversals and trailing stop conditions.
- Heikin Ashi or Candlestick Candles: Use either chart type to visualize trend continuation and exhaustion.
🟢 BUY & 🔴 SELL Signal Visualization
🟢 BUY Signal: Displayed as a green rectangle beneath the candle with “BUY” written in white.
Triggered when a bullish candlestick closes above the EMA and the Pdot appears below the candle.
🔴 SELL Signal: Displayed as a red rectangle above the candle with “SELL” written in white.
Triggered when a bearish candle closes below EMA and the Trend indicator appears above the candle.
Trade Exit Level
🔺 A red triangle marks the suggested exit for BUY trades.
🔻 A green triangle marks the suggested exit for SELL trades.
This confluence-based approach filters out noise and helps avoid false signals during sideways or volatile market conditions.
---
⚙ Best Use Guidelines
Recommended for: 15m, 1H, and 4H timeframes
- Chart Type: Traditional Candlesticks
- Combine with the ParthFintech SMART Indicator for enhanced levels of; Support and Resistance Zones, Order Blocks (OB), Fair Value Gaps (FVGs)
This multi-indicator confluence strengthens your trade decisions with Smart Money insight.
---
🛡 Why Choose SMART-MOVE
- Built with discipline and precision in mind
- Designed for traders who value quality over quantity
- Easy-to-read signals with built-in trade management prompts
- Developed by professionals with over a decade of trading experience
---
📧 For access and queries contact: support@parth-fintech.com or parth-fintech.com

S&R Zones MTF (TechnoBlooms)S&R Zones MTF – Multi-Timeframe Support & Resistance Boxes
🔍 Overview
S&R Zones MTF is a professional-grade yet beginner-friendly indicator that dynamically plots Support & Resistance zones across multiple timeframes, helping traders recognize high-probability reversal areas, entry confirmations, and price reaction points.
This tool visualizes structured zones as colored boxes, allowing both new and experienced traders to analyze multi-timeframe confluence with ease and clarity.
🧠 What Is This Indicator?
S&R Zones MTF automatically detects the most significant support and resistance levels from up to four custom timeframes, using a configurable lookback period. These zones are displayed as colored horizontal boxes directly on the chart, making it easy to:
Spot where price has historically reacted
Identify potential reversal or breakout zones
Confirm entries with institutional-style precision
🛠️ Key Features
✅ Multi-Timeframe Zone Detection (up to 4 timeframes)
📦 Auto Plotted Boxes for Support (Blue) & Resistance (Pink)
🧱 Dynamic Height based on average price range or fixed input
🏷️ Timeframe Labels to instantly identify zone origin
🎛️ Customizable inputs: Lookback length, box color, height style
🔁 Real-time updates as price structure changes
🎓 Educational & Easy to Use
Whether you’re a new trader learning about price structure, or a professional applying institutional concepts, this tool offers an educational layout to understand:
How price respects historic zones
Why multi-timeframe zones offer stronger confluence
How to use zones for entry, exit, or risk placement
📈 How to Use (Multi-Timeframe Strategy)
Select Your Timeframes – Customize up to 4 higher timeframes (e.g., 1m, 5m, 15m, 1h).
Observe Overlapping Zones – When multiple timeframes agree, those zones are more significant.
Entry Confirmation – Wait for price to reach a zone, then look for reversal patterns (engulfing candle, pin bar, etc.)
Combine with Other Tools – Use alongside indicators like RSI, MACD, or Order Blocks for added confidence.
💡 Pro Tips
Zones from higher timeframes (1H, 4H) are often more powerful and reliable.
Confluence matters: If a 15m support zone aligns with a 1H support zone — that's a high-probability reaction area.
Use break-and-retest strategies with zone rejections for sniper entries.
Enable "Auto Height" for a more adaptive, volatility-based zone display.
🌟 Summary
S&R Zones MTF blends precision, clarity, and professional analysis into a visual structure that’s easy to understand. Whether you're learning support & resistance or optimizing your MTF edge — this tool will bring clarity to your charts and confidence to your trades.

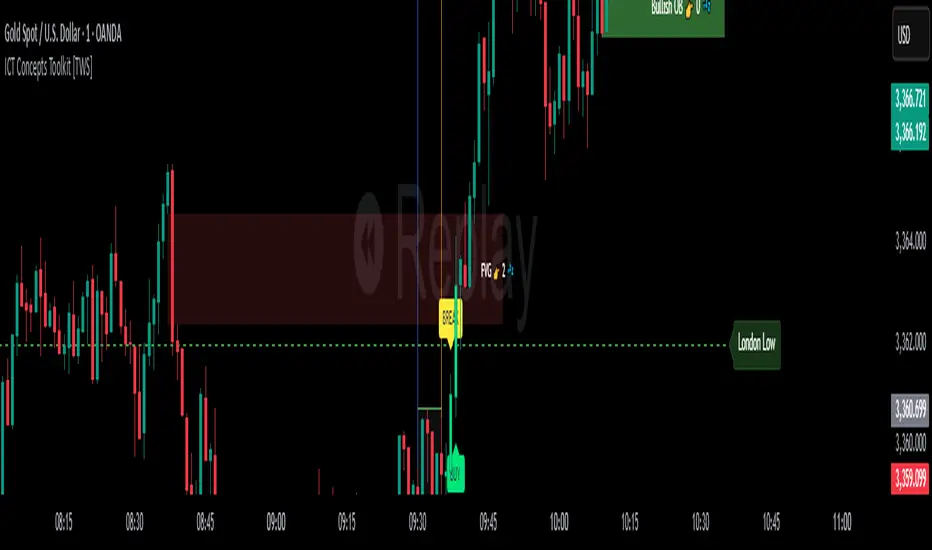
ICT Concepts Toolkit [TWS]
ICT Concepts Toolkit – by Trade With Stevie
Unlock the full power of Inner Circle Trader (ICT) concepts with this all-in-one indicator built for serious traders.
The ICT Concepts Toolkit combines the most powerful price action tools into one clean, efficient, and highly customizable interface — perfect for mastering market structure and timing precision entries.
✅ Features Included:
🟩 Order Blocks – Automatically detect key institutional levels for potential reversals and entries.
📉 Fair Value Gaps (FVGs) – Visualize imbalances in price action to spot high-probability targets and mitigation zones.
📊 Support & Resistance – Dynamically plotted levels to track market structure and trend shifts in real-time.
📅 Previous Daily Highs/Lows – Key liquidity zones marked for precision scalping and swing setups.
🕒 Session Zones – Clearly defined Asian, London, and New York sessions with customizable times and colors.
📌 Extension Lines – Extends each session’s high and low to the current candle for ongoing bias and liquidity mapping.
🚦ICT Morning Signal – Your personal directional bias assistant: smart signals showing when to Buy or Sell based on ICT’s powerful Morning Model logic.
Whether you're trading Forex, Futures, or Crypto — this toolkit gives you a cleaner chart, clearer bias, and more confidence in your setups.
💡 Created by Trade With Stevie — follow for more smart tools and signal insights.